

Have you ever pondered why the stock market moves in a peculiar rhythmic manner? Those patterns aren’t just random—they often follow an incredible mathematical sequence known as the Fibonacci series.
What is Fibonacci Retracement?
Fibonacci Retracement is a predictive tool used by traders to identify potential support and resistance levels in the market. The concept derives from the Fibonacci sequence—a series of numbers where each number is the sum of the two preceding ones. Think of it like the natural patterns we see in shells or sunflowers.
History of Fibonacci Numbers
Leonardo Pisano Bogollo, also known as Leonardo Fibonacci, introduced this sequence to the western world. However, what’s mind-blowing is that these numbers can also be found in financial markets!
How does Fibonacci Retracement work in trading?
The magical dance between numbers and stock movements is a sight to behold. But how does it actually transpire?
Primary Fibonacci Ratios
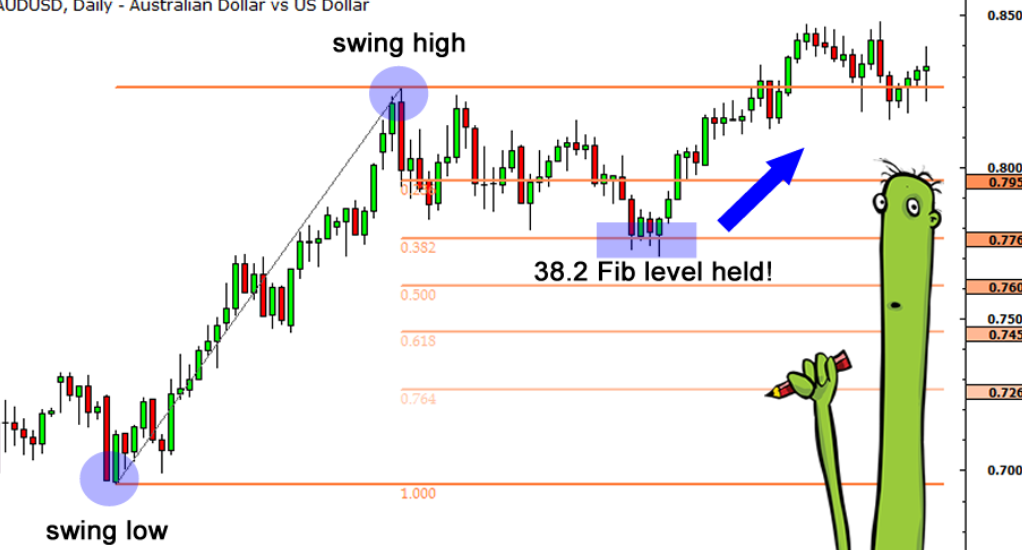
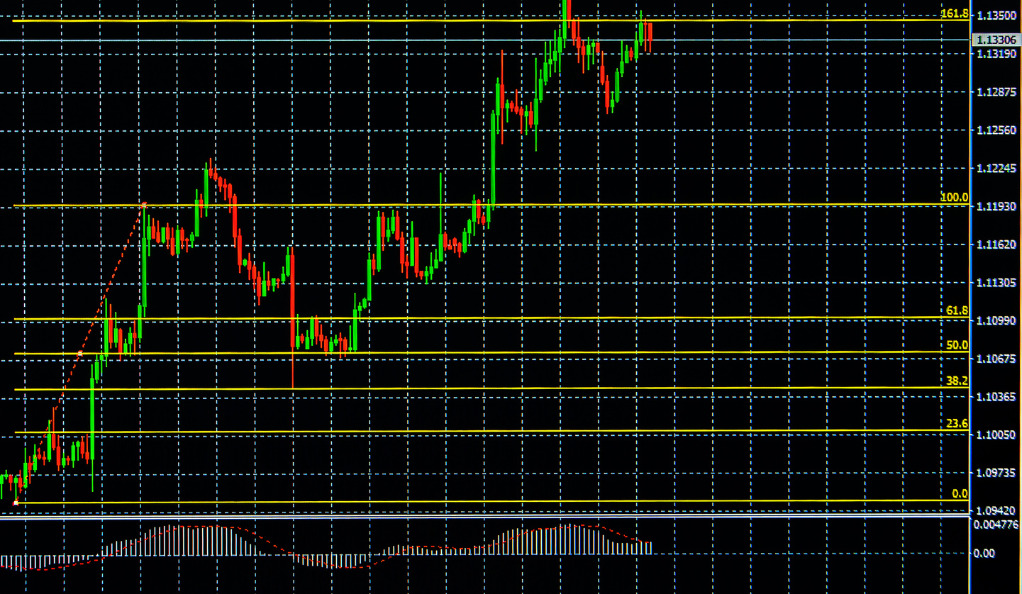
Fibonacci Retracement focuses on certain ratios: 23.6%, 38.2%, 50%, 61.8%, and 78.6%. These percentages represent potential reversal points in the market. Ever wondered why a stock reverses its trend after climbing or dropping a certain distance? Well, Fibonacci might be whispering the answer.
Using the Fibonacci Tool on Trading Platforms
Most trading platforms have the Fibonacci tool. All you need to do is select the peak and trough, and voilà! The software magically draws the potential retracement levels for you.
Importance of Fibonacci Retracement in Trading
Like a compass to a sailor, the Fibonacci Retracement guides traders through turbulent market seas.
- Predicting Market Corrections: One of the standout features of the Fibonacci Retracement is its ability to predict potential market corrections. These predictions can be golden for traders, ensuring they don’t sail into stormy waters.
- Risk Management: Beyond predictions, it’s a formidable tool for risk management. By knowing potential reversal zones, traders can set stop losses effectively, ensuring they don’t lose more than they bargained for.
Practical Tips for Using Fibonacci Retracement
A tool’s efficacy lies in its use. So, how should one harness the power of Fibonacci Retracement?
- Key Levels to Watch: Always keep an eye on the 38.2% and 61.8% retracement levels. Markets have a quirky affection for these levels, often showing significant reactions.
- Incorporating with Other Indicators: While the Fibonacci Retracement is powerful, combining it with other indicators, like moving averages or RSI, can create a fortified trading strategy.
- Mistakes to Avoid: Ahoy, traders! While sailing the Fibonacci seas, ensure you don’t fall into these traps.
- Over-reliance on Fibonacci Alone: It’s tempting to rely solely on Fibonacci levels, but remember—the market is influenced by myriad factors. Always consider the bigger picture.
- Ignoring Market Sentiment: Even if Fibonacci points to a potential reversal, always gauge the market sentiment. Are other traders as optimistic or pessimistic as you?
The Power of Multiple Indicators
In the ever-evolving landscape of trading, relying solely on one source of information can be likened to navigating a ship with a single star. It’s not just about having a direction, but ensuring that direction is accurate and reliable. The age-old adage, “Two heads are better than one,” perfectly encapsulates the essence of this concept. By employing multiple indicators, traders can gain a multifaceted perspective, ensuring they capture the full spectrum of market dynamics.
However, it’s not just about quantity but also the quality and synergy of these indicators. Each trading indicator offers its unique insight, and when used in tandem, they can complement each other, reducing false positives and enhancing overall analysis. So, while one might provide a broad overview, another can delve into specifics, giving traders a clearer, more comprehensive picture of the market. In this intricate dance of numbers and trends, it’s always wiser to have more partners guiding your steps.
Conclusion
The Fibonacci Retracement is more than just numbers; it’s an insightful tool to decode market patterns. By understanding its essence and integrating it with other indicators, traders can navigate the market maze with finesse.
FAQs
The Fibonacci sequence is a series where each number is the sum of the two preceding ones, starting from 0 and 1.
No tool is foolproof in trading. While Fibonacci Retracement provides valuable insights, it should be used in conjunction with other tools and research.
The 50% level isn’t directly from the Fibonacci sequence but is observed to be a crucial reversal level in market movements.
Yes, Fibonacci Retracement can be used in stock markets, forex, commodities, and even cryptocurrency markets.
Begin by identifying significant peaks and troughs in your trading chart and apply the Fibonacci tool. Combine its insights with other indicators for a comprehensive strategy.
ACDX.io aims to provide balanced and reliable information on cryptocurrency, finance, trading, and stocks. However, we refrain from offering financial recommendations and encourage users to conduct their own research and thorough verification.
Read More